I tried to verify how fast the mnist of Chainer example can be speeded up using cython
Why do
It has been accelerated since Chainer 1.5. It was mentioned that cython was used as one of the causes of speeding up, so I had a simple question as to how fast it would be if I rewrote the example with cython, so I tried it.
PC specs
OS:OS X Yosemite CPU: 2.7GHz Intel Core i5 Memory:8GHz DDR3
conditions
Use example Mnist Number of learning: 20 times The data has been downloaded in advance
Visualization
Visualization with profiler
Use pycallgraph
http://pycallgraph.slowchop.com
install graphviz
http://www.graphviz.org/Download_macos.php
Install X11 (for Yosemite)
http://www.xquartz.org/
If you get failed with error code 256
https://github.com/gak/pycallgraph/issues/100
When using pycallgraph
python pycallgraph graphviz -- ./file name.py
What I want to do
1: Visualization and profiling of normal processing 2: Simple cython 3: Static type setting by cdef 4: Cythonization of external modules
Initial state

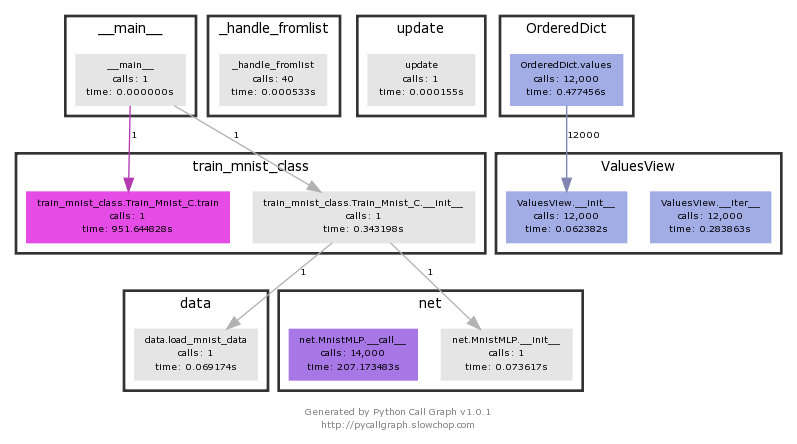
Visualization gives you an idea of which parts are taking longer. train_mnist.Train_Mnist.train You can see that it takes 951 seconds.
The result of a normal profile is below.
ncalls: number of calls tottime: total time spent by this function percall: tottime divided by ncalls cumtime: The total time spent (from start to end) of this function, including the subordinate functions. This item is also measured accurately in recursive functions. percall: cumtime divided by the number of primitive calls
This time, due to cython's convenience, the code has been changed, so the processing time is different from the above. I really wanted to use pycallgraph with cython, but I couldn't use it due to my lack of knowledge. If anyone knows how to use it, please let me know (the processing of the cython part will not be listed under normal usage)
It finishes in 755.154 seconds.
Execution method
python -m cProfile
Profile.prof

         37494628 function calls (35068627 primitive calls) in 755.154 seconds

   Ordered by: internal time

   ncalls  tottime  percall  cumtime  percall filename:lineno(function)
    72000  448.089    0.006  448.651    0.006 adam.py:27(update_one_cpu)
   114000  187.057    0.002  187.057    0.002 {method 'dot' of 'numpy.ndarray' objects}
   216000   31.576    0.000   31.576    0.000 {method 'fill' of 'numpy.ndarray' objects}
    12000   23.122    0.002  163.601    0.014 variable.py:216(backward)
Based on the 2: 8 principle, focus on the part that takes the longest to process. You can see that adam.py takes almost most of the processing time, and numpy's matrix operations continue to devote the processing time.
cython
I also wanted to graph it in cython, but I did not have enough knowledge of the author and could not graph only the processed part of cython, so I profiled it.
The result is slower than 800 seconds
Profile.prof

         37466504 function calls (35040503 primitive calls) in 800.453 seconds

   Ordered by: internal time

   ncalls  tottime  percall  cumtime  percall filename:lineno(function)
    72000  473.638    0.007  474.181    0.007 adam.py:27(update_one_cpu)
   114000  199.589    0.002  199.589    0.002 {method 'dot' of 'numpy.ndarray' objects}
   216000   33.706    0.000   33.706    0.000 {method 'fill' of 'numpy.ndarray' objects}
    12000   24.754    0.002  173.816    0.014 variable.py:216(backward)
    28000    9.944    0.000   10.392    0.000
The processing part of adam.py and variable.py is slower than before cythonization. There is a possibility that it is slow due to the cooperation between the c language converted by cython and the external processing of python.
cdef
I defined cdef with the expectation that it would be faster to define a static type in advance using cdef.
Advance preparation
When I used it on mac as it was, an error occurred, so I took various measures.
When I try to use cimport, I get the following error:
/Users/smap2/.pyxbld/temp.macosx-10.10-x86_64-3.4/pyrex/train_mnist_c2.c:242:10: fatal error: 'numpy/arrayobject.h' file not found
In the following directory
/usr/local/include/
Copy or pass the header directory found by the following command
find / -name arrayobject.h -print 2> /dev/null
It was 776 seconds.
Profile.prof

         37466756 function calls (35040748 primitive calls) in 776.901 seconds

   Ordered by: internal time

   ncalls  tottime  percall  cumtime  percall filename:lineno(function)
    72000  458.284    0.006  458.812    0.006 adam.py:27(update_one_cpu)
   114000  194.834    0.002  194.834    0.002 {method 'dot' of 'numpy.ndarray' objects}
   216000   33.120    0.000   33.120    0.000 {method 'fill' of 'numpy.ndarray' objects}
    12000   24.025    0.002  168.772    0.014 variable.py:216(backward)
It is an improvement over simple cythonization, but since there is not much change in adam.py and variable.py, it is slower than python processing due to extra C language and Python language conversion processing.
adam.py cython
I tried to speed up the part that takes the longest processing by converting adam.py to cython.
As a result, it showed the effect of being about 30 seconds faster.
Profile.prof

         37250749 function calls (34824741 primitive calls) in 727.414 seconds

   Ordered by: internal time

   ncalls  tottime  percall  cumtime  percall filename:lineno(function)
    72000  430.495    0.006  430.537    0.006 optimizer.py:388(update_one)
   114000  180.775    0.002  180.775    0.002 {method 'dot' of 'numpy.ndarray' objects}
   216000   30.647    0.000   30.647    0.000 {method 'fill' of 'numpy.ndarray' objects}
    12000   21.766    0.002  157.230    0.013 variable.py:216(backward)
The processing time of optimizer.py, which contains adam.py, is about 20 seconds faster than that of python. This worked and became faster.
Summary
Instead of simply cythonizing and trying to speed up, I found that profiling and cythonizing only where it really works may have an effect. It was an Advent calendar that I was able to experience that the cycle of hypothesis, visualization, and verification is important, rather than trying to get rid of it.
The code I tried to execute is listed below. https://github.com/SnowMasaya/chainer_cython_study
reference
Chainer: a neural network framework https://github.com/pfnet/chainer
Recommended Posts